
With all the attention on the four V’s of Big Data – Volume, Velocity, Variety and Veracity, there’s a V that doesn’t get enough credit: Visualization. It’s true that value from big data lies in analyzing analytics. But how do you make big data available to a larger audience, at the right time and right place, so that they can take action on it? Often, there’s not time for offline analysis.
This is where Big Data Visualization comes in. Even data scientists use this as a key step in their big data analytics to visually explore the data to understand it better.
Using Big Data Visualization to Make Better and Faster Decisions
Recently we analyzed Twitter streams against regional crime data to correlate the two. We had a big data framework set up to ingest huge amount of Twitter data and regional crime data. We used Cassandra as the data store and Apache Spark as the data processing engine. Cassandra offered us very valuable features that we needed to store and query this huge amount of data. For example, horizontal scalability, high availability, write optimization, structured records, secondary indexes, and so on. We were able to use the power of Spark to process this data and run analytics.
However we wondered about the best way to visualize this data in order to add more value and make it available to a wider audience. Ideally they could access the data on a browser and interact with it. This is the goal of big data visualization.
This is when Tableau and ODBC driver for Cassandra came to the rescue. Simba offers ODBC driver for Cassandra that enables direct SQL query translation to the Cassandra Query Language (CQL) via native API. It complies with ODBC 3.8 data standard which supports asynchronous execution. It is compatible with Cassandra 2.x and lets you do direct BI connectivity without extracts. It adds joins to queries and lets you do aggregation. Schema can be generated dynamically via intelligent sampling.
Datastax also offers the Simba ODBC driver for Cassandra for their Datastax Enterprise, as well as for open source Cassandra. The Datastax ODBC is available for free on their website.
In our case, we used the Simba ODBC. Installing the driver was very straightforward – as simple as running the downloaded executable and choosing your installation location. Once ODBC driver was installed, we needed to register it so that it is available as a DSN entry in the tools that we wanted to use, like Tableau. We ran the ODBC Administrator (64 bit or 32 bi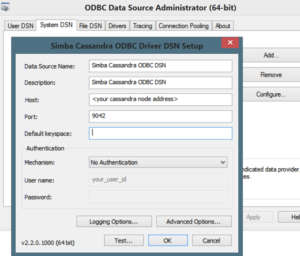 t depending on your machine) program. Below is a screen shot of what you need to enter – mainly your host address and the port where Cassandra is running.
Once this was done, we were able to connect to the ODBC data source in Tableau Desktop and choose the above created DSN from the drop down list. Once connected in Tableau, we selected the schema and tables and linked them. This will work on any similar data source to which you have access to in Tableau.
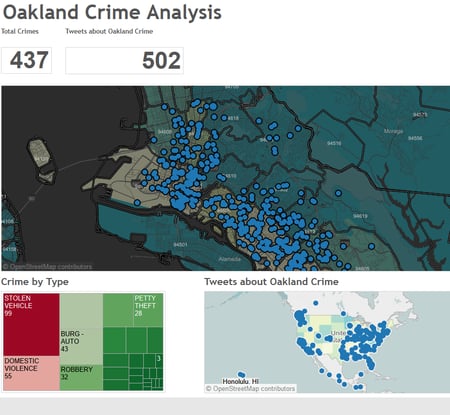
Now we were able to create visualizations that helped us make sense of this huge amount of data in a very intuitive and interactive way. It also allowed us to answer more questions from the data.
We were able to choose a region like Oakland, and map the crimes to the longitude – latitude grain. At that point we used Tableau to lay over demographics like median household income by zip code. We could see if pockets of crime related to income or any other factors like occupation, race etc. We were able to see where in the USA tweets are being sent related to crimes in Oakland. We were also able to see the time of the day when crimes are happening and any trends. Thus with big data visualization, non-technical people without technology knowledge could use the data to interact and gain insight into the crime patterns.
This type of data visualization is a big win in any type of business, but especially where decision makers need to make quick and right decisions. Always-on connectivity and interactivity in actionable visualizations is a huge win in the new era of big data.