
How to use Analysis Services Tabular to get near real-time updates for your Power BI dashboards
Analysis Services provides three different approaches for creating a business intelligence semantic model: tabular, multidimensional, and Power Pivot. Analysis Services Tabular is a great self-service backend for use with the Power BI service, however keeping it updated and refreshed for the enterprise can be confusing. There are many processing options at the database, table, and partition level to help you speed up processing time, but they can be hard to navigate.
A good place to start is a Microsoft whitepaper, Perf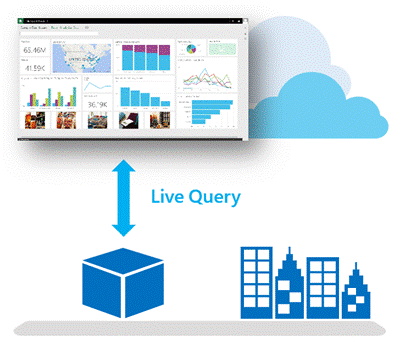 ormance Tuning Tabular models in SSAS 2012. This document explains processing options in a lot more detail. In a recent business intelligence engagement, we looked at this whitepaper and other sources in order to optimize our client’s experience with Power BI. Our goal was to achieve the best performance possible, and along the way we learned a few things we want to share.
Parallel Processing
A key to our goal was realizing that sending the “Process Full” command to our Tabular database processed groups of tables in parallel. After extensive checks in SQL Profiler, we realized the engine figures out which tables to run in parallel. It’s very quick on small tables and larger ones take longer as the engine imports and compresses that data in-memory. After a while, we realized we could do something about the smaller tables in our project.
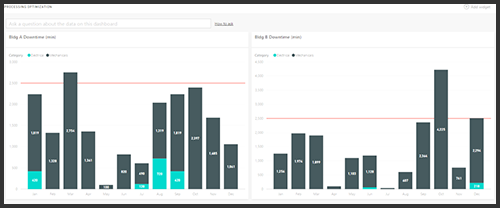
On the same engagement, we used Master Data Services (MDS) for data stewards to maintain small entities such as KPI targets. We’d bring in these entities to display thresholds on multiple dashboard tiles dynamically (as illustrated below). We wrote “Process Full” commands against these small tables in a separate XMLA script and marked the batch with Transaction=false and witnessed these tables getting refreshed in less than a few seconds! We ran our XMLA command in a SQL job every few minutes and it gave users the experience of making real-time updates to their Power BI dashboard tiles.
We also found some schemas that did not require a refresh most of the day. For example, we had a historical inventory fact table that held daily inventory snapshots. Once the cube processed the most recent daily snapshot, there was no need to process the table at all for the rest of the day. So we grouped all the other schemas in a separate XMLA command, marked it Transaction=false, made sure we checked that the fact table was caught up, and then let the SSAS hardware and software do the rest of the heavy lifting. This saved a ton of time in cube processing and allowed us to establish a more frequent data refresh schedule.
Incremental Processing
Snapshot fact tables like the Inventory one just mentioned seemed like a great use case for the “Process Add” command, but we learned a couple things implementing this command. First, this command will process new rows in your model by changing the table’s partition query to filter new data rows, or “delta rows”, since Analysis Services does not auto-detect incremental data. If you have a sizable snapshot fact table like we did, this can save you a ton of processing time, but you have to be careful.
The textbook description of “Process Add” says you’ll change the partition query of your table to process new data. What most books won’t tell you is that you could (and should) control when and how to change the partition query of a table. A couple key points to take away from our findings:
- Once you’ve successfully run Process Add, change the partition query back by removing the WHERE clause effectively removing the filter for delta rows.
- Check whether a Process Add is needed by comparing the last snapshot date in your fact table with the last snapshot date in your tabular model.
The first point will save you a headache in case someone tries to reprocess the table or partition ad hoc after running “Process Add”. The second is so you don’t accidentally process the same delta rows multiple times.
Conclusion
The good news is that Analysis Services Tabular yields high performance analytical databases that integrate easily with Excel, Reporting Services reports, and other BI applications from Microsoft and third-party applications. We hope these tips will save you processing and development time. It’s important for end users of Power BI to get their data refreshed as frequently as possible. With Power BI’s Enterprise Gateways and their DirectQuery capability, it becomes a game of how to optimally process your cubes.
Pravina Parthasarthy is a Business Intelligence engineer at DesignMind. She specializes in SQL Server Analysis Services Tables and Power BI.