
Why Use Bookmarks and Buttons in Power BI Reporting?
Selections, bookmarks and buttons bring an application-like experience to your Power BI reports. When developing Power BI reports, using bookmarks and buttons together does more for you than just add pleasing aesthetics. It gives users the ability to switch between saved states of filters and slicers with the push of a button. Setting up multiple bookmarks/buttons makes navigation of your report much more straightforward to end users, both new and experienced, with your data or to Power BI.
Setting Up Power BI Bookmarks
Bookmarks allow users to look at a saved state of specific filters or visuals. Bookmarks can apply to ‘all visuals’ on a report page or ‘selected visuals’ on a page.
All visuals should be used in the case when switching between bookmarks and wanting the page to return exactly how we left it. This will work for defaulting a page on a visual that uses the spotlight feature.
Selected visuals allow for different visuals to be used between each bookmark, although the visuals may look the same, each visual can contain different fields. Also, another case for using selected visuals is for persistent filters. This allows for a slicer on a page to be selected when switching between bookmarks and not defaulted and across page filtering will persist if the slicer is the same.
Pro tip: Having the Selection, Bookmarks and other panes open while in Power BI can get overwhelming. Want to keep you reporting space cleaner while working? Click the pane “name” to collapse the pane. When you’re ready to use it again, simply click the “name” again.
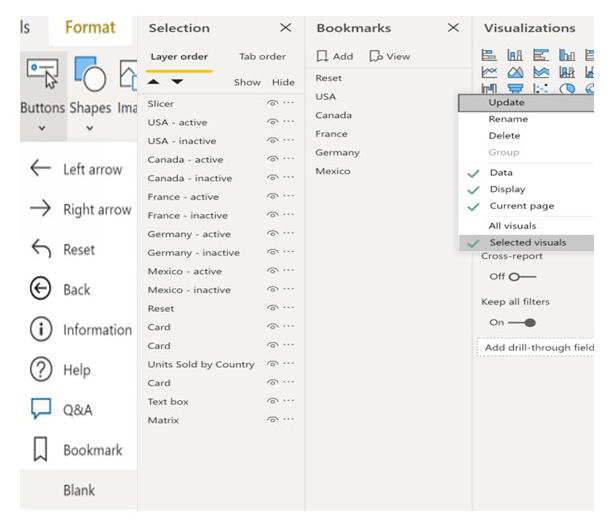
Updating Bookmark Using ‘All Selected’
- Create a bookmark and rename it.
- Set the page with filters, matrix list ordering, or spotlight.
- Hover over the bookmark ellipse and update the bookmark.
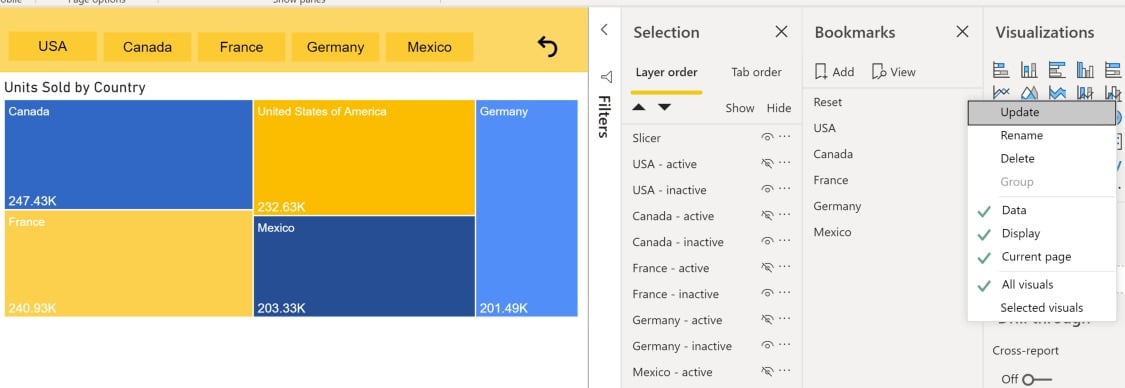
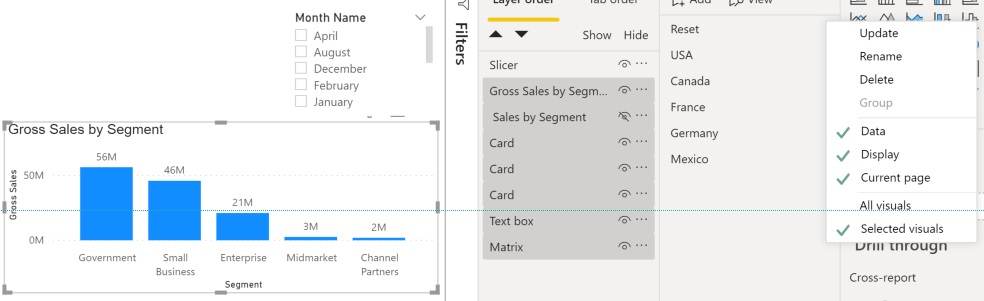
Updating Bookmark Using ‘Selected Visuals’
- In the selection pane move all slicer visuals to the top.
- Select all the visuals beside the slicers.
- Update the bookmark with all the selected visuals still being highlighted. This will allow the slicer to persist when filtering across bookmarks.
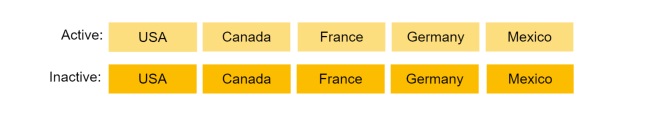
Setting Up Active/Inactive Buttons Power BI Report
Pairing together buttons and bookmarks allows users to actively click, hover and engage in the Power BI report. Buttons can be customized or redesigned through text, sizing, and shape. We create active and inactive buttons that are in the same position, however, when one button is being used the other button is hidden.
- Create a button by selecting the ‘buttons’ drop down and select ‘blank’ under the Insert tab in the ribbon.
- Duplicate one button and make a button a darker color shade for the active button and reduce the transparency to 50% on the other button.
- Assign the active button an ‘action’. Select a button and in the visualizations pane turn on the ‘action’ and for action type select ‘bookmark’ and choose the respective bookmark then stack the active and inactive button on one another.
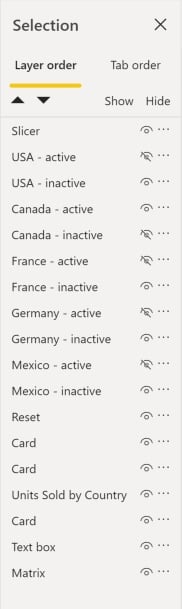
How To Use The Selection Pane in Power BI
The selection pane has the ability to ‘show’ and ‘hide’ visuals including buttons. By changing the buttons name and moving slicers and buttons at the top of the selection pane make updating bookmarks more organized. For the naming convention for each button, you can distinguish each button by their name followed by “active” or “inactive”.
The Bottom Line for Bookmarks and Buttons in Power BI
With the addition of bookmarks and buttons, end users will find navigation of your reports more straightforward and user-friendly. They will easily find the information they are seeking and become more skilled at utilizing Power BI to make business decisions.
Access more tips about using Power BI on our Power BI and Data Visualization page.
Ready to elevate your Power BI reports and dashboards? Learn more about our Power BI services or contact us to schedule a free consultation.
Brendan Phan is a BI Consultant at DesignMind.