
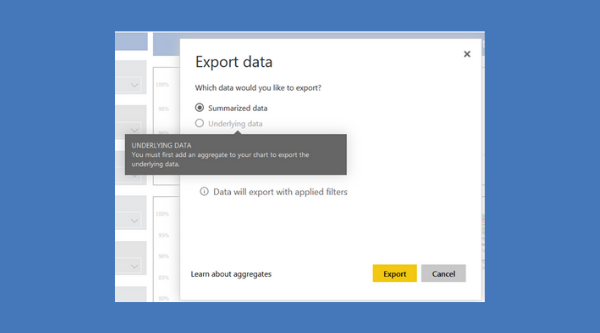
In order to make data visualizations even more useful, you need to learn how to export underlying data in Power BI. When you publish a report to your workspace and you’d like to export the underlying data from a table visualization, you may see the underlying data option greyed out and only see the summarized data. When you hover on top of the underlying data, it will say “You must first add an aggregate to your chart to export the underlying data.”
Understanding Summarized Data and Underlying Data in Power BI
Before you try to export the underlying data in Power BI, it’s important to understand the differences between summarized data and underlying data. Summarized exportation will only export aggregated data points in the visualizations. On the other hand, underlying data will export additional data that is not displayed in the visualization but are relevant to the visual.
When To Export Summarized Data Vs When To Export Underlying Data in Power BI
You should export summarized data when you want to see the relevant data in the visualization. Summarized data will only show the columns and measures that you created for the visualizations. If the visual contains aggregation, the export will contain aggregated data.
You should export underlying data in Power BI when you want to see the relevant data and additional data from the data model you have created in Power BI. However, if your visual contains an aggregation, it will not be exporting the aggregated data.
Both data types will be exported to an xlsx file, and your internet browser will prompt you to save the file and open it in Excel.
How To Export Underlying Data In Power BI
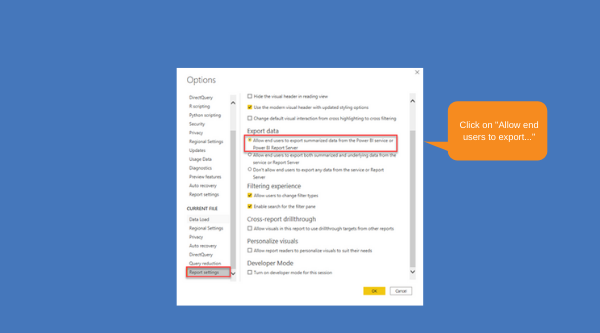
First, you have to make sure you have the correct settings. In Power BI Desktop, please select File > Options and Settings > Options > Current File > Report Settings, then under Export Data subtitle, please enable “Allow End Users to Export Both Summarized and Underlying Data from the Service.”
If the first step worked for you, congratulations. If the first step did not work for you, and the underlying data option is still greyed out, you need to create an aggregate function and implement it in the Power BI Visual. This can be achieved by creating a Power BI calculated measure and using any aggregate function, and then importing it inside the visualization. I like to use the SUM function, but functions like MIN, MAX, AVERAGE work too.
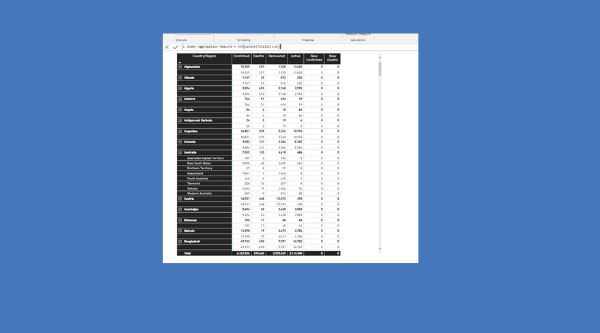
Remember, the function does not have to make sense; you are simply creating the function to bypass the export blockage in the Power BI Service. After you import the aggregate function inside of the data visualization, you can hide the aggregate function by minimizing the column. After it is complete, you can publish the report again.
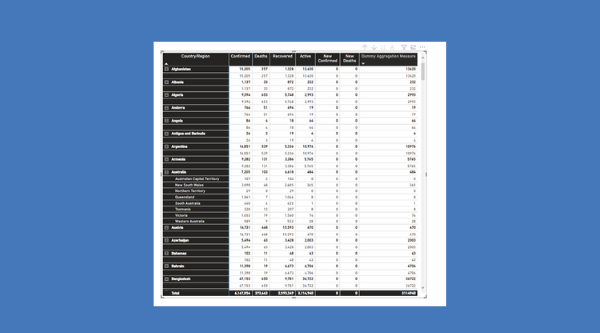
Congratulations, you are now able to export both summarized and underlying data from the Power BI Service! You can learn more about Power BI on our Power BI and Data Visualization page.
Tune up your Power BI reports and learn more about our suite of Power BI services or contact us to schedule a free consultation.
Chennie Teng is a BI Consultant at DesignMind.