
Sometimes dashboard and reporting projects call for customizable data visualizations that are not part of the package. Power BI offers a number of visualizations out of the box (OOB) and in AppSource, but when they aren’t enough, what should you do? That’s where Power BI Custom Visuals come in.
Power BI Custom Visuals provide a way to extend OOB functionality with other open source visualization tools like D3, jQuery, and R. This gives you a great deal of flexibility in terms of formatting, visual elements, and capabilities. Microsoft even provides the source code for some of their OOB visualizations. This allows you to to make tweaks and learn yourself, if you choose to do so.
The downside is that custom visuals bear a heavy load. You’ve got to know Java, D3, CSS, HTML, and possibly other languages to complete a custom viz package (PBIVIZ). You’ve also got to be intimately familiar with all the different aspects of a custom visual project to be effective. For example, field well combinations, formatting options, drill-through and tooltips all have different areas of the custom visual project that require a user to know where they are, how to code, and how to tie them all together.
At DesignMind, we help clients break these Power BI custom visuals down so that we can get you a minimum viable product that you can take over and make subtle tweaks to, as needed. Here’s some pointers on how to get one of these projects underway.
Power BI Custom Visuals Step by Step
1. Break Down The Design Elements
As with any project, you first need to break down the elements of what you want to build. What may seem simple at a moment’s glance can quickly turn complex when you factor in all the variables.
Let’s look at an example.
Below is a circle card visual that Microsoft includes in their Power BI report tutorial on how to build custom visuals. Let’s break it down to its visual elements:
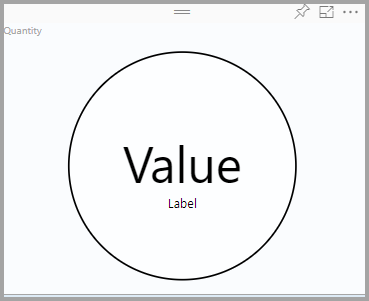
- Circle with a border
- White background color in the circle
- Value text
- Label text
Okay, not too bad. So, let’s say you install this and get everything working on your laptop. Once you start playing with the visual, you start to ask questions: How does resizing the visual work? Does it auto-scale? Should the data labels be in a fixed position or allow the user to choose formatting options? How do you change the background of the circle based on the data? How can I add more data to this visual? What about tooltips? Drill-though?
So, after giving it some thought and talking with your team, your breakdown starts to grow:
- 1. Data Wells:
- Value
- Label
- Color
- 2. Formatting Options:
- Border/No Border
- Font
- Font Size
- Font Color
- Value Positioning
- Label Positioning
- 3. Tooltips
- 4. Drill-through
Now, this is just the beginning. After you and your team have the night to sleep about it, you come back with all kinds of ideas: icons, arrows, sparklines, etc.
Like with all projects, narrowing down the scope to get a minimum viable product (MVP) is critical to getting acceptance, feedback, and championing
2. Get The Visual Studio Code Editor
Visual Studio Code is probably the hottest code editor out there on the market today(At least for Microsoft development). It’s fast to develop, fast to extend, and continually updated every month just like Power BI! If you don’t already have this tool in your development toolbelt, try it out. It’s great for text editing, but you will ultimately need to learn it if you plan to do anything with Power BI reporting custom visuals.
3. Get Source Control And Check In Your Work
If you don’t already have source control, get some. There are plenty of providers out there that you can use for free like GitHub, Bitbucket, or Azure DevOps. If you don’t already have a source control provider (SCP), we recommend GitHub, a provider known for its speed. To integrate GitHub with Visual Studio Code, all you need is to download and install Git. Checking your code into GitHub is easy and there’s no excuse not to do it this way.
4. Learn: Trial Basic Power BI Reporting Visualization Packages To Build Your Skill Set
Probably the easiest way to learn how to build Power BI custom visuals is to start with a basic visualization package like D3. Take advantage of online tutorials and examples to help you along the way as you grow your skill set. Try them out and impress your friends.
5. Test Live Or Test In Power BI Desktop
If you go through the Microsoft tutorial online, they walk you through how to set up a development environment which is beneficial if you’re making small incremental changes to your code. In the end, be sure you can package your custom visual with the pbiviz package command. That produces the magical pbiviz file that you can then import into Power BI Desktop, tie to your data and publish to the Power BI Service to see your work in all its grandeur.
We’d Love To Hear From You.
If this task seems daunting, talk to us! We’d love to hear about what custom visual you have in mind and how we might be able to help. Our team at DesignMind has years of experience designing, developing, and architecting Power BI solutions for organizations, large and small. You can see more tips from our Power BI experts here.
If you’re interested in elevating your Power BI reports and custom visuals, learn more about our suite of Power BI services or contact us to schedule a free consultation.
Gnanaprakash Rajamanickam is a BI Consultant at DesignMind.