
Is your Power BI report too slow? In my last post, I focused on Power BI report performance problems caused by memory issues and the tools available to diagnose those issues. Today we will be shifting focus and I will show some of the ways you can determine why a Power BI report is slow during navigation or selecting from a slicer or visual. Some of the tools I will discuss require high-level knowledge of Microsoft Power BI model design and DAX formulas.
When Your Power BI Reporting Is Too Slow
Throughout my time working with various clients, developing and architecting Power BI reports, our clients continue to ask why some reports seem to render very slowly. Sometimes those Power BI reports don’t exhibit performance issues until they are fully deployed to the Power BI Service. In this post, I will share the methodology I follow when optimizing Power BI report performance.
Why Should You Care That Your Power BI Report Is Running So Slowly?
When a Power BI report runs slowly, valuable resources are being consumed and are not available to other reports and users. There can be many causes of performance issues, such as. model design, calculated columns, calculated measures, visuals and/or the amount of data being displayed on the report. One side effect of a slow running Power BI report is the stress on memory consumption. In addition, the more users consuming the reports, the more non-optimized performance will affect your users and your organization.
How To Discover And Speed Up Power BI Report Performance
Prior to the introduction of the Power BI Performance Analyzer, the task of assessing performance issues were squarely in the hands of the Power BI developer.
Here is the list of tools that are part of my arsenal when working on any Power BI performance assessment project.
- Power BI Performance Analyzer: This tool allows the Power BI developer to review the performance of each report element, such as visuals and DAX formulas.
- DAX Studio: This is a third-party tool from SQLBI developed to write, execute, and analyze DAX queries against Power BI reports, Excel Power Pivot, and Analysis Service Tabular models.
- VertiPaq Analyzer: This is another SQLBI tool that allows you to analyze VertiPaq storage structures for a data model in Analysis Services Tabular, and also for Power BI Documents
- Memory Consumption Footprint: Learn more in “Are Your Power BI Performance Issues due to High Memory Consumption?”
Performance Tuning Cycle
Sometimes Power BI report performance issues do not come to light during development; instead, it becomes a performance issue when users start consuming the Power BI report on the Power BI Service. The performance issue might come up in a conversation in which a user mentions a report has been running too slow or a visual is taking too long to render. During a performance tuning project, I like to break down the computing effort, as shown here.
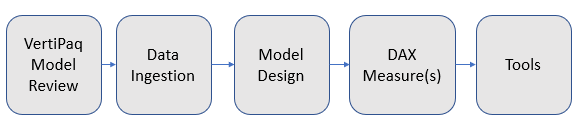
The flow of the task is not always linear or left to right, since there might be times where we have to review the analytic model due to calculation or report requirements.
Performance Scenario
Our client has informed us that there is a Power BI report that contains ten pages with a set of visuals per page and a compressed size of 300 MB. The report is suffering from performance issues.
Let’s Try To Resolve This Problem
To work with slow performance, we need to download a copy of the report to our local computer and open it using Power BI Desktop. Next, we need to get some insight into the report model without having to go through each table and inventory everything by hand. VertiPaq Analyzer provides a schema plus inventory of a Power BI or tabular model with other information such as cardinality information, compression, hierarchy, calculated columns, calculated measures and more in one Excel document.
Here are the steps needed to connect to the Vertipaq Analyzer document.
A. Install DAX Studio
B. Download VertiPaq Analyzer
The ZIP file includes various versions of the Vertipaq Analyzer excel document. Please review the readme file found on the zip file to determine which excel document. Once you determine which excel document to use, make sure that you enable Power Pivot for excel.
C. Open the Power BI report using Power BI Desktop
D. Open DAX Studio
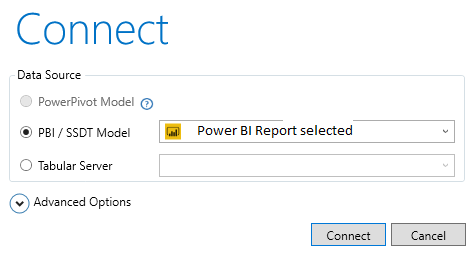
- Click on Connect, in order to connect to open Power BI report from step C and press the Connect button
- You should be able to see the Power BI Data Model on your screen as shown below
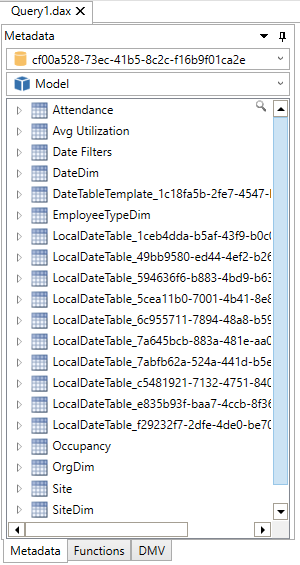
- In order to connect the Vertipaq Analyzer you will use the connection string to the Power BI Report
- In DAX Studio, make a note of the localhost:port found on the bottom far right, as shown in the figure below

![]()
- Open the Vertipaq Analyzer version according to the readme describe in step B
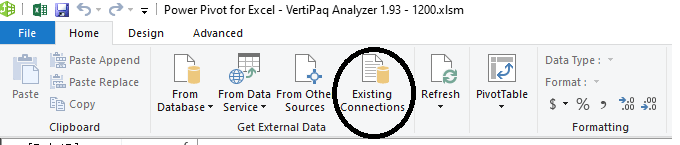
- Once the excel document is open, click on Power Pivot and Select as shown below
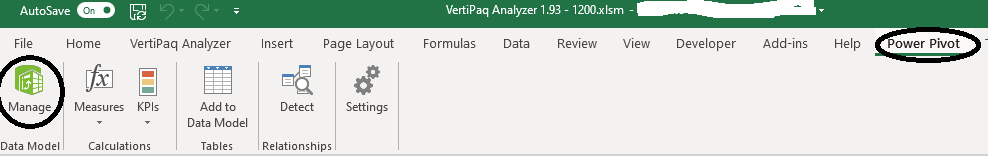
- This will open the Power BI Manage Screen, where you will click on the Existing Connections in order to change the current Vertipaq Engine connection to your current Power BI Report

- When you click on Existing Connections, select SSAS and press the edit button to change the connection information
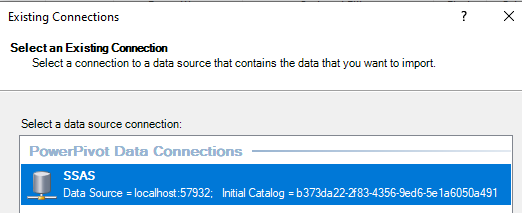
- In the connection screen you will select Build, which will open the Data Link Properties window
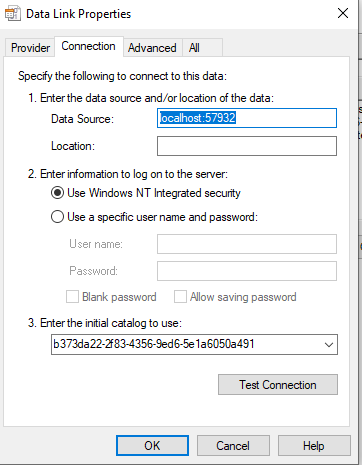
- In the Data Link Properties window under the Data Source, enter the information you retrieve from the DAX Studio i.e Localhost:XXXXX
- Once you enter the Data Source, click the dropdown for “Enter the initial Catalog to use” in order to select the actual Power BI Model database
- Press the “Test Connection” to make sure you can connect to the Power BI Model
- Press OK, then SAVE, and finally Close
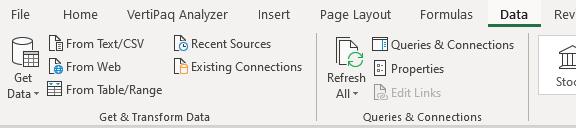
- If everything went well, click on the Save button and then on the Excel button to return to the Excel report

- Once in the Excel report, Click under the Data Menu -> Refresh All
This shows a sanitized version of the report we are going to be working with:
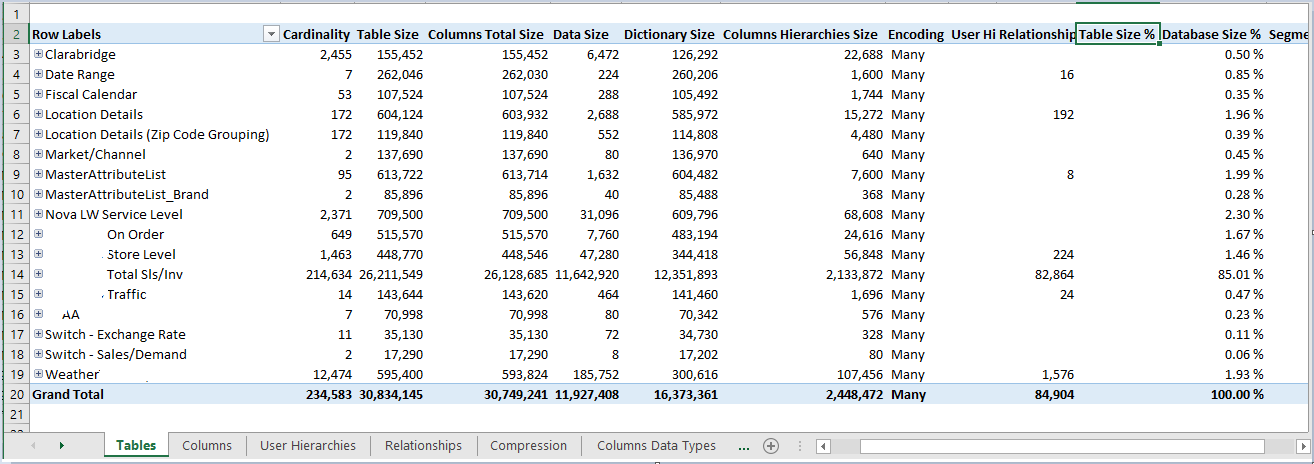
The image above shows one of the many information tabs that the Vertipaq Analyzer tool creates related to the number of tables, compression before, compression after, and other information.
One of the key pieces of information from this tool is column cardinality, the count of unique values in a column. This information is important when looking at how well a column compresses. If it is an identity column with unique values for each row, the Vertipaq engine will not compress. When compression is not optimal, the memory usage can get very large.
Data Ingestion
I recommend that data ingestion be carefully reviewed with respect to how much memory is allocated during the data refresh. You may be depriving your Power BI environment of much-needed resources. Since this data ingestion performance is not the focus of this blog post, we will leave this topic for a future post.
Model Design
Although Power BI is a self-service model that allows the data to be modeled with few restrictions, careful design consideration should be implemented to optimize the Vertipaq engine. A model can consist of a single table, or multiple tables with relationships (Many to One, One to Many, Many to Many, etc.). In this blog, we will use the model shown here:
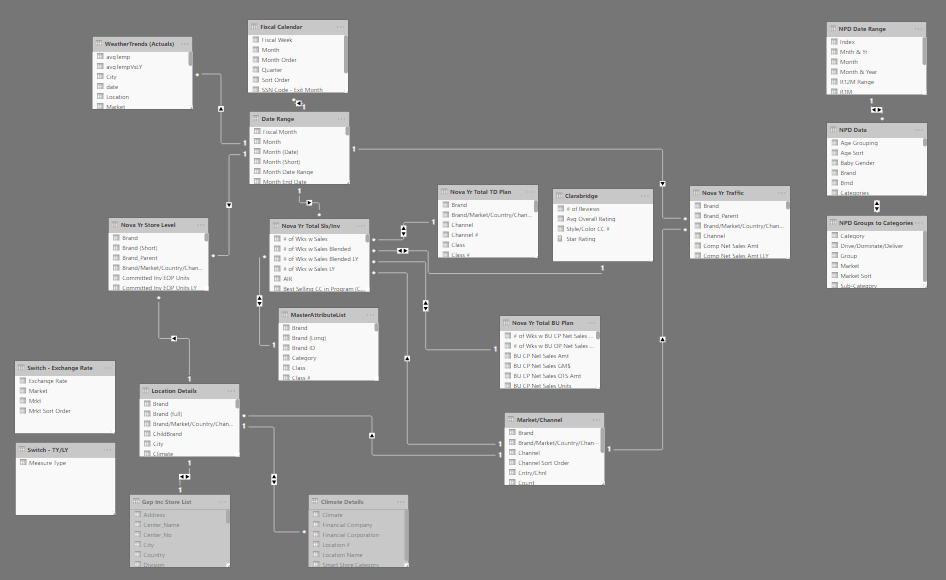
The model above shows the usage of bi-directional relationships, support parameter tables, and hidden tables.
DAX Measures
As the client or consumer reported, the Power BI report in question performs poorly. Using Power BI Performance Analyzer, we can get a first-hand look into each page(tab) performance.
Steps to get baseline performance on each report tab:
- Open the report in question using Power BI Desktop
- Create a blank page for this report and save it.
- While on the blank page, close the report. Close the Power BI report while in the blank page. This will allow the report to open directly on the blank page and not run any other report page prior to running the Performance Analyzer.
- If possible, close any other open applications
- Open Power BI Desktop
- Open the Power BI report in question, making sure that it opens on the blank page
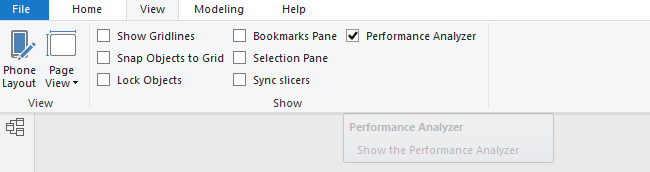
G. While on the blank page, click on Menu->View->Performance Analyzer to enable performance capture
H. With the Performance Analyzer enabled
Click on “Start Recording”
Click on the desired report page to record the performance log
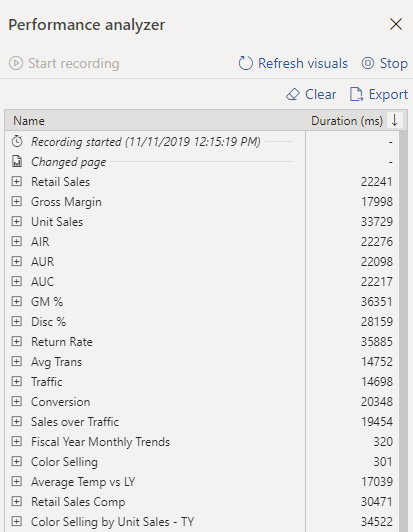
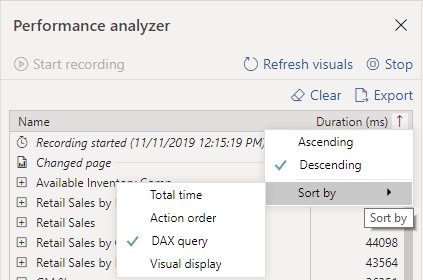
I. Since we are interested in the query time, click on the arrow pointing down and select Descending and Sort by DAX Query to display the worst performing queries, according to the business predefined time to render threshold (3-5 second max)
J. Here are some of the worst performing DAX queries, expressed in milliseconds
K. Once the performance capture is completed, click on Stop and select Export to save the performance log file for later review as a JSON file
L. Once you have saved the performance file for the current page, click on Clear, then click on Start recording and move to the next page, and iterate from step H to K as needed
Performance Analyzer log review
Once the Performance Analyzer logs have been created, the process to review and fix poorly performing queries begins. In our case, we will take a single poor performance log and try to find a solution. The DAX Studio tool allows us to not only write a DAX formula, but also to check what is happening in the Formula Engine and Storage Engine.
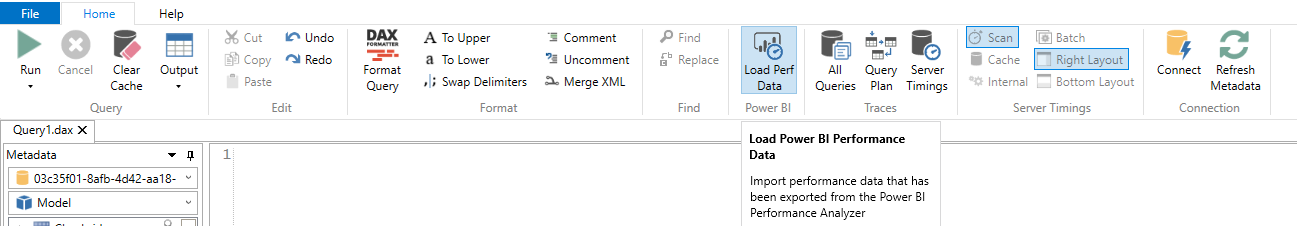
To investigate a Power BI report using DAX Studio, we will first need to open the Power BI report using Power BI Desktop. Once the report has been opened in Power BI Desktop, we will start the DAX Studio tool and connect to the Power BI report. Once connected, we will then click on “Load Perf Data” to load any of the captured Performance Analyzer log files, as shown in Fig 5.
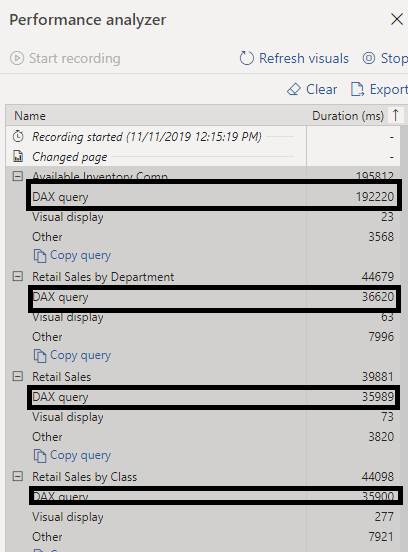
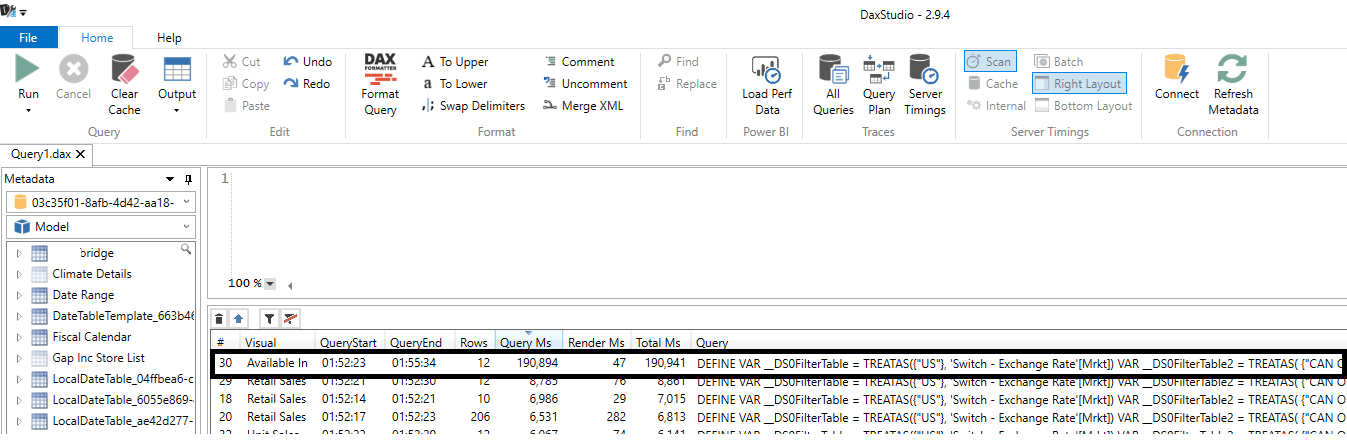
Once the Performance Analyzer log has been opened, we should be able to see all of the query’s issues against the model for the Power BI report page in question, as shown in Fig 6. This figure shows a query that is taking 190,894 milliseconds (3.18 minutes) to complete (WOOO).
While in DAX Studio, we will click on the query in question to display the code in the empty window, as shown in figure 7.
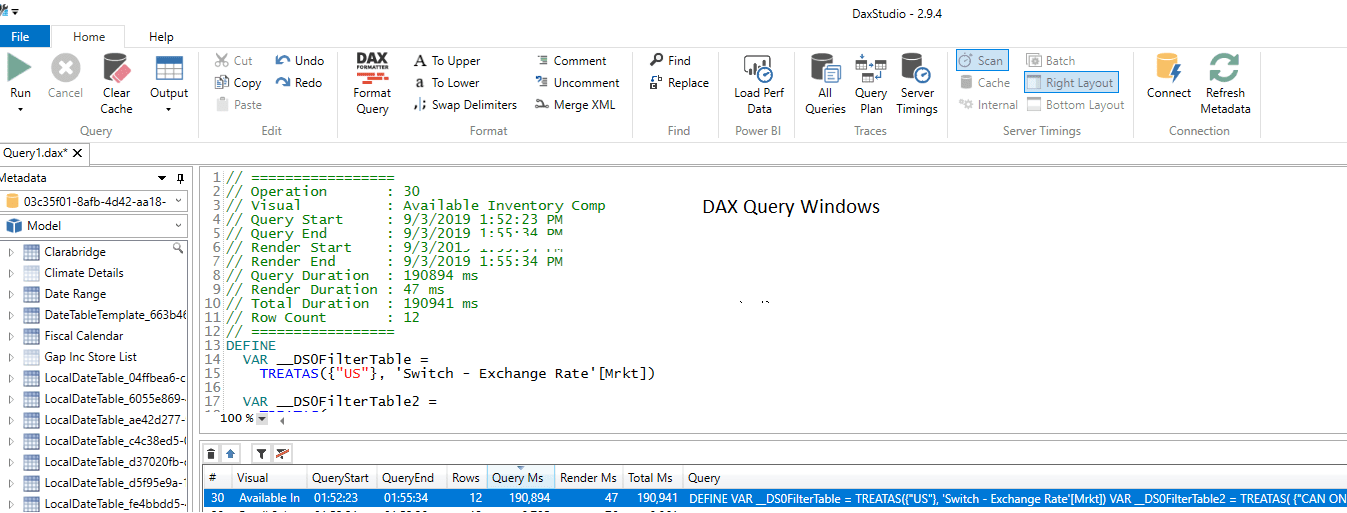
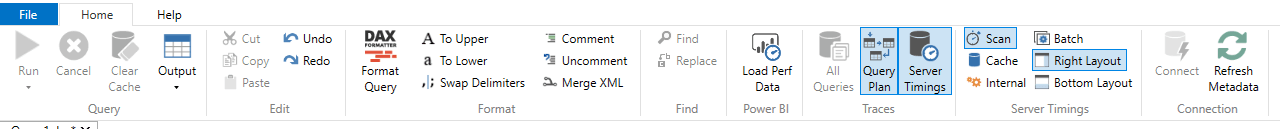
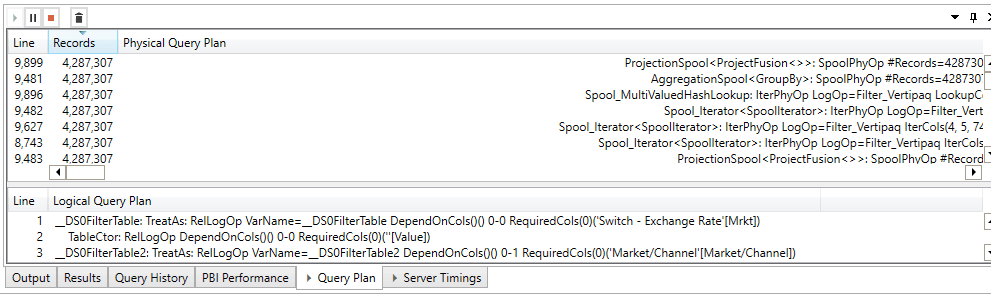
It’s great that we can see the performance issue, but how can we see what is happening behind the scenes? We want to see the actual performance and the break-down of the query execution. On this screen we will click on the “Query Plan” and “Server Timing” to provide the query time profile and query plan.
To get a baseline for the poor performance visual query, we will run this query as follows:
- Click on the clear cache
- Click on the Run
- Once the run has completed, make a note of the following items:
- Server Timing
- Formula Engine
- Storage Engine
- CPU
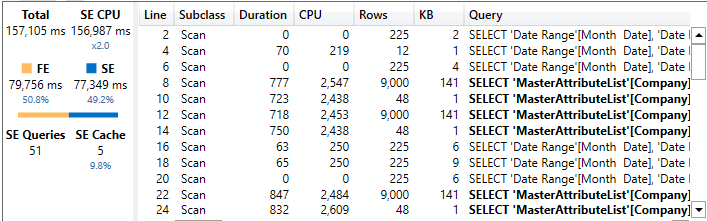
- Review the Query Plan
- Number of records that it is iterating against
- Number of lines
Once we have completed our baseline, we need to review the actual DAX query to determine what is making our query perform so poorly. Below is a copy of the original poorly performing DAX Query:
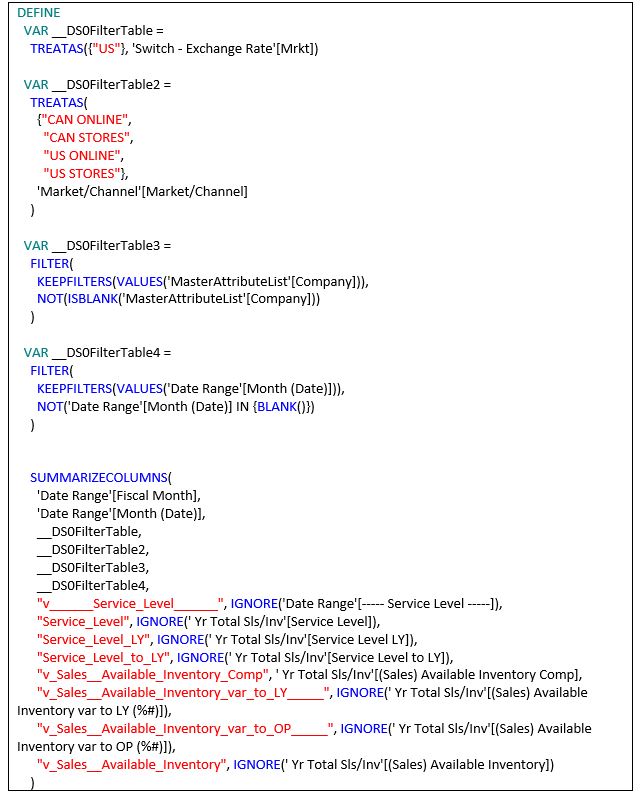
The DAX query in question contains seven calculated measures, so we executed each measure individually by commenting the other six one by one to get their performance metrics. The table below shows each DAX measure time to complete performance and Server Timing metrics.
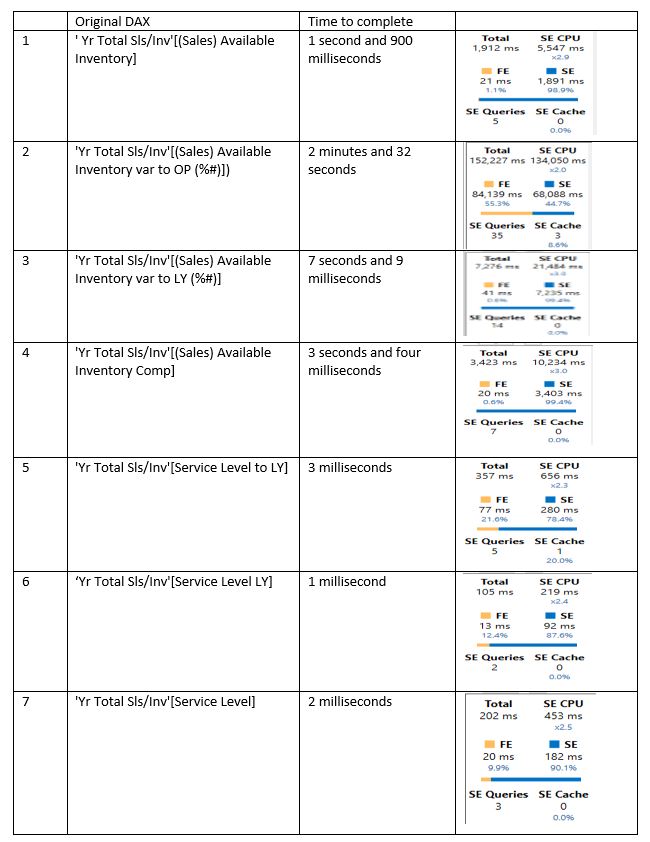
As we can see from our performance inventory, query number 2 is the one that is taking the longest amount of time to complete, so we are going to review the actual DAX code and see how it can be improved.
While still in DAX Studio, we will use the search capability to look for the DAX measure plus its dependents and see what is making this DAX formula run so slowly. When searching for the DAX measure in question, we want to select the ‘Define Dependent Measure” to retrieve all of the in-between DAX measures used by the final DAX measure shown below.
The table below shows the before DAX query and the modified version:
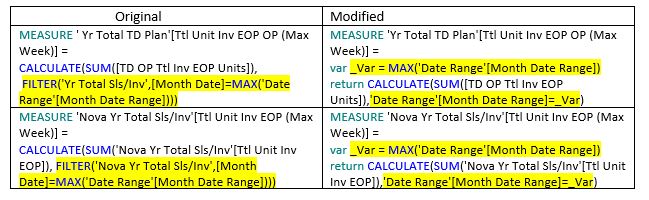
The query performance issues in our case were related to the usage of a Table Filter instead of a column filter. The original formula was iterating through the 4 million-plus records by using a Filter, which once replaced with a column filter, the actual size of the number of records we needed to iterate is reduced.
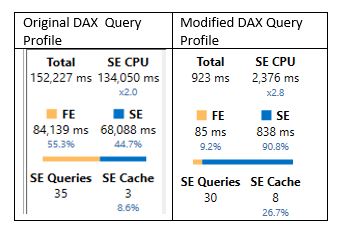
The table shows the performance profile before and after modifications:
Resources For When Your Power BI Report Is Too Slow
By going through the performance review cycle of VertiPaq Model, Data Ingestion, Model Design, DAX, and the various tools, you should be able to understand and fix almost any Power BI report performance issues.
Here are resources that might be of help when development or troubleshooting Power BI reports.
- SQLBI Tools such as “DAX Studio,” VertiPaq Analyzer,” “DAX Editor,”BISM Normalizer” and many more
- The Importance of Star Schemas in Power BI
- Comparing DAX calculated columns with Power Query computed columns
- The Definitive Guide to DAX Book Second Edition
Our Power BI team at DesignMind can help you as you implement Power BI in your organization. Learn more about our suite of Power BI services or contact us to schedule a free consultation.