How To Use Power BI to Enhance Data Exploration
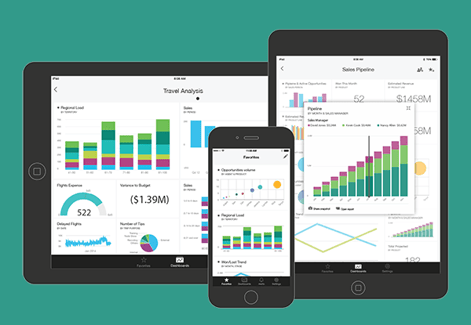
In our previous post, we explored how you can leverage Power BI’s visualizations. Today, we’re reviewing how Power BI Desktop’s recent improvements help explore your data. Information Age claims 2018 will be the year of data literacy. It seems Microsoft fully anticipates this; late last year, several features were added to Power BI to improve data exploration. While data visualization is an important step in leveraging Power BI’s advantages, Power BI is more than pretty graphs and charts.
You can learn more about what our experts are writing about Power BI here.
Slice data by space and time
Slicers are a very popular filtering feature of Power BI. Microsoft continues to innovate the slicer control by adding date and numeric slicers. These controls make data exploration even easier. Both slicers filter data ranges with a slider and Min/Max entry. Just ensure your data is of the date or numeric data type, and Power BI handles the rest. Now, instead of filtering through large lists of discrete values, users can quickly filter their data frame on a continuous scale. By removing the tediousness from date-based data exploration, Power BI has made it easier for your team to explore trends and changes over time in more personal, flexible, and relevant ways.
Group and Bin Data for Deeper Insights
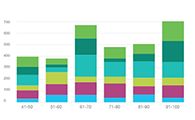
Your team members using Power BI aren’t just looking for raw data, they’re looking for trends they can act on. Power BI’s new grouping and binning tools will make finding those trends simpler. Users can now group points of data on visuals. This makes it easier to explore and analyze related categories. There are all sorts of things that can be grouped. For example, users can view sales data by category or type, then explore data within those groups. In addition to grouping, numerical and time fields can be binned together. This works well for exploring related sales figures, calendar periods, customer satisfaction scores, and more.

Top N filter and Include/Exclude Data Points
With access to so much business data, finding relevant information can feel overwhelming. Power BI has two new features we think will help solve this challenge. Top N filter and Include/Exclude Data Points help users narrow their searches. The Top N filter allows users to sort a category by a specific measure (for example, “top 5 product categories by sales”). Include/exclude data points allows users to add data they may want to investigate further, or remove data points they don’t need to see. This helps users view relevant data faster and hold important discussions with decision makers. Based on our experience, teams that can get to the right data sooner gain significant competitive advantages.
The New Matrix (preview)
The new Matrix control that the Power BI team is developing gives us the wonderful ability to cross-filter from a Matrix. See the following post for a preview of what this guy can do. Up until now, BI tools have followed the same formula:
• Chart cross-filters textual tables
• Textual tables have drill-through capability
With this new Matrix control, it flips the equation, giving the dashboard designer new ways to tell data stories by putting down values and seeing what detail correlations can be drawn from the numbers. Many business stakeholders prefer to work with numbers instead of data visualization. With this new control, you can meet the numerical needs of the business, while visually depicting comparisons and trends based on a certain slices of data, such as month, sales rep, territory, or customer.
Use the Right Platform to Gain Business Intelligence Advantages
Identifying hidden gems inside a dataset improves business decision making. The recently added Power BI features we covered show a clear trend toward greater data literacy. The race to harness business intelligence has started. Power BI capabilities can help your business leverage powerful data insights and gain competitive advantage.
Now you know more about how to use Power BI to enhance data exploration. Soon you’ll be making smarter decisions, faster throughout your organization. Learn more about what Power BI can do for your organization, or simply contact us about your situation.
Angel Abundez is VP, Solutions Architecture at DesignMind.