
DAX functions for Time Intelligence only works properly with Calendar Years.This blog post explains how to accomplish the Year-over-Year period comparisons when Fiscal Year calendars are in use.
When you work with date dimensions in Microsoft Power BI, you’re lucky if you can use Calendar Years, as that will allow you to leverage built-in DAX functions such as PARALELLPERIOD, SAMPERIODLASTYEAR, TOTALYTD, etc. to create Time Intelligence measures. However, many companies define custom Fiscal Year calendars, which may not start on January 1 and end on December 31, to fit their business requirements.
Power BI measure design varies depending on the specific situation; however, one solution I have used to deal with custom Fiscal Year calendars is to standardize the Day of Year number for every day of each year from 1 to 365. Doing this will make it possible to do proper Year-over-Year period comparisons when custom Fiscal Years calendars are in use.
Calendar Year And Fiscal Year Have Different Start Dates
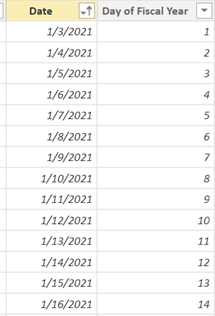
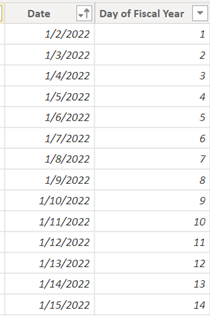
In the screenshots below, the Date column for the Fiscal Years shows a start date that is slightly off from the Calendar Year: Fiscal Year 2021 starts on 1/3/2021 and Fiscal Year 2022 starts on 1/2/2022.
To compare sales on the same period basis between Fiscal Year 2021 and Fiscal Year 2022, I created a calculated column Day of Fiscal Year to mark both 1/3/2021 and 1/2/2022 as the first day of each fiscal year.
The remaining days will get their Day of Fiscal Year value calculated incrementally up to 365 (366 if there is a leap year). The corresponding fiscal year of each date is already given.
Standardize the Fiscal Date
The date table used is named dim_fiscal_date. You can use the following DAX measure for the calculated column Day of Fiscal Year.
Day of Fiscal Year = CALCULATE(
COUNTROWS('dim_fiscal_date'),
FILTER(
ALL(dim_fiscal_date),
dim_fiscal_date[Fiscal Year] = EARLIER(dim_fiscal_date[Fiscal Year]) &&
dim_fiscal_date[Date] < EARLIER(dim_fiscal_date[Date])
)
)+1
Compare Current Year And Previous Year Sales In A Line Chart
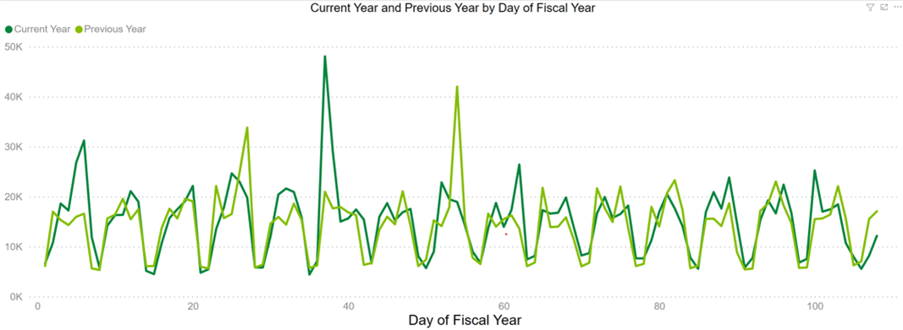
My goal is to create a line chart to visualize the sales of the previous Fiscal Year and current Fiscal Year to compare them on the same period basis. At the time of composing this blog, the latest date was 5/18/2022 which is day 108 of the 2022 fiscal year and I want to show the previous year's sales only up to the same day 108 of the 2021 fiscal year.
The Sales (Current Year) measure is straightforward with a simple SUM function. The report users are supposed to select a target year to see the relevant data. The Previous Year sales measure is a little bit more complicated because you need to take into consideration the target year and the cut-off day to match two lines on the chart with the same end day.
Previous Year =
VAR max_date = CALCULATE(LASTDATE(dim_fiscal_date[Date]), ALL(dim_fiscal_date))
VAR max_year = CALCULATE(VALUES(dim_fiscal_date[Fiscal Year]), ALL(dim_fiscal_date), dim_fiscal_date[date] = max_date)
VAR target_year = SELECTEDVALUE(dim_fiscal_date[Fiscal Year], max_year) - 1
VAR today_fiscal = CALCULATE(VALUES(dim_fiscal_date[Day of Fiscal Year]), ALL(dim_fiscal_date), dim_fiscal_date[Date] = max_date)
VAR result = CALCULATE([TDV], dim_fiscal_date[Fiscal Year] = target_year, dim_fiscal_date[Day of Fiscal Year] <= today_fiscal,
dim_fiscal_date[Day of Fiscal Year] in DISTINCT(dim_fiscal_date[Day of Fiscal Year]))
RETURN result
- target_year is a previous year so it is one year less than the selected year.
- today_fiscal is the Day of Fiscal Year value corresponding to the latest date, which is the max_date variable in the formula.
- The conditions for the Previous Year's sales result are:
- Fiscal year is equal to the target year calculated above.
- The cut-off day of the previous year is the latest Day of Fiscal Year from the current year.
- Day of Fiscal Year must be unique (DISTINCT function) for the previous year to distinguish it from that of the current year because I use Day of Fiscal Year as the X-axis in the line chart for both years.
After preparing the measures, you can proceed to lay down the Current Year Sales and Previous Year Sales on the same line chart with a standardized Day of Fiscal Year on the X-axis.
With this trick, I hope that now you have more options for dealing with comparison of Year-over-Year periods with custom Fiscal Year calendars during your Power BI development work.
DesignMind’s team of experts works to design and build Power BI solutions for companies of all sizes. You can find more tips from our Power BI professionals here.
Lan Dao is a BI consultant at DesignMind. She specializes in solving Power BI problems.