
Are You Taking Full Advantage of Power BI Visualization?
Microsoft Power BI has helped revolutionize business intelligence across the enterprise. Yet some companies still aren’t taking full advantage of Power BI visualization features and maximizing their capabilities. Gartner reports by 2018, most business users and analysts will have access to self-service data analysis tools. As business intelligence gains widespread adoption across every industry, companies need to take every advantage of their platform of choice.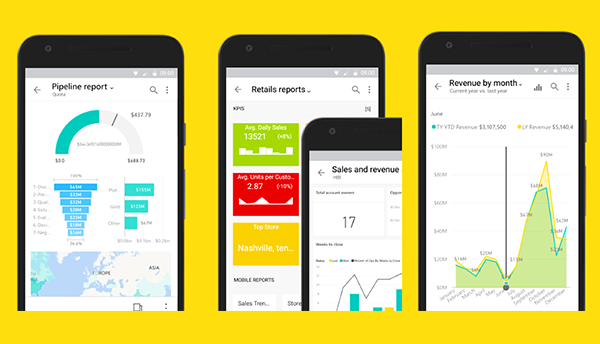
At DesignMind, we’re invested in how our clients can leverage business intelligence solutions like Power BI to their fullest. As a Microsoft Power BI Partner, we carefully monitor how Power BI has evolved and share these insights with our clients. In this article, we’ve identified several key ways organizations using Power BI can enhance the platform’s capabilities in 2017.
Let’s get started with how you can step up your Power BI visualization capabilities now.
Incorporate R Visuals
R is an open source programming language and development environment. In the past, organizations had to turn to (often poorly supported) open-source solutions to generate R visualizations from their data.
Now, Power BI has added support for R programming through R visuals. With thousands of ready-to-use packages, the R language adds endless complementary capabilities for analyzing and visualizing data.
In practice, this gives your team remarkable flexibility in exploring and displaying your data.
Microsoft has made adding R visuals in the Power BI service simple. Even if users don’t understand the underlying technology behind R visuals, they can utilize the feature through Microsoft’s R-Powered custom visuals library. (For an example of how simple this is, check out our post on Data Visualization with Power BI and R Visuals.)
When we’ve implemented Power BI with customized R visualizations, our clients have been thrilled with the results. Suddenly, they have unlimited ways to visualize data and gain insights, and they can add new customized visuals as needed.
Increase Embedded Data Presence Across Solutions
One of the goals of business intelligence is bringing data-driven insights to every function. What if this data was always available, no matter what application was being used? Imagine, for example, a real-time dashboard embedded into non-BI applications (such as desktop, mobile, or web apps). Rather than forcing users to open and view reports in their BI solution of choice, they would always have a dashboard in front of them.
Thanks to the release of Power BI Embedded, embedding data across applications is now possible. Businesses can embed reports and visualizations into their web, mobile, and desktop apps. Faster access to real-time data means faster (and better) decision making. As your business embraces Power BI embedded to bring your reports everywhere you need it, you’ll shift from reactive business intelligence to proactive data analysis and reap the benefits.
Improve Report and Visualization Design
Power BI’s new Snap-to-Grid feature improves report attractiveness and readability through simple snap-in-place canvas grid lines. This includes evenly distributing visuals and adjusting which visualizations overlap. Users won’t have to pore over data as closely to quickly understand which decision is the right one. Now you can see each Power BI visualization in a visually pleasing, uncluttered way.
Design Dashboards for Mobile
Previously, if you wanted to see how a Power BI dashboard would appear on mobile, you had to follow a two-step process:
- Publish the dashboard
- Pull out a mobile device and check how it looked
This hassle meant reports often weren’t designed for mobile users. However, Power BI now allows users to create a phone view of a dashboard. Even better, the phone view can be developed before publishing. This lets users experiment with mobile views without affecting the desktop view. Optimizing the dashboard for mobile users – and exploring data on-the-go – is easier and quicker than ever.
Upcoming Trends in Data Exploration
In my next post, I’ll explore how Power BI can augment your data exploration. To learn more about Power BI, check out what we’ve been writing lately. If you want help implementing Power BI capabilities at your organization, let’s chat. Seeing your data come alive with Power BI visualization is easier than you might imagine.
Angel Abundez is VP, Solutions Architecture at DesignMind.